
One of the most commonly requested features we’ve had from our customers at Office365Mon has been something to help them better understand network performance with their Office 365 tenants. Today we’re happy to announce that we have released a set of services, tools and reports to do just that. You can breakdown the performance of your Office 365 tenant between what’s happening in the tenant itself versus the network transport of your requests. You can compare what the network performance is like to your Office 365 tenant from the different geographies where you have users. You can also set notification thresholds, so you can be alerted when network performance at any location becomes unsatisfactory.
We rolled out the first part of this suite of services in June, with support for monitoring tenant Health Scores and farm processing times for SharePoint Online and One Drive for Business. We’ve extended that model now to include the following:
- Set notification thresholds for network performance times from cloud-based probes
- Set notification thresholds for network performance times from every geographic location where you install our Distributed Probes and Diagnostics agent
- Capture network performance metrics for all cloud-based as well as Distributed Probes and Diagnostics agents
- Monitor One Drive for Business – as well as SharePoint Online and Exchange Online – with the new version of our Distributed Probes and Diagnostics agent
With these new features turned on, we’ll monitor and capture tenant- and network-specific performance metrics with each health probe we issue for SharePoint Online and One Drive for Business. This, coupled with our other performance and availability data, gives you a very clear picture of when and where problems or potential problems may be happening throughout your organization. That helps you understand where bottlenecks are happening as they occur and gives you the insight needed to focus your resources where they can best be utilized.
Here’s a real-world example that occurred during an early release of these services. Notifications were sent out for a tenant from multiple Distributed Probe agents in different geographies because the roundtrip time for the health probe exceeded the limits that had been set. However, the network performance alerts did not fire, which meant that network transportation time was within limits even though the overall roundtrip time was not. Looking at the reports in our Advanced Report gallery, you could also see that during this same time the tenant processing times had spiked. In addition to that, the Health Scores of the tenants also were spiking (the higher the Health Score, the less healthy the tenant is considered to be, ironically). By looking at these data points we could tell that in this instance the performance issue was all as a result of a bottleneck in the Office 365 tenant itself, not in the network. That meant that there was no need for us to spend resources trying to evaluate our network, run diagnostics there, try to identify bottlenecks in it, etc. – in short, saving us a whole bunch of time and money.
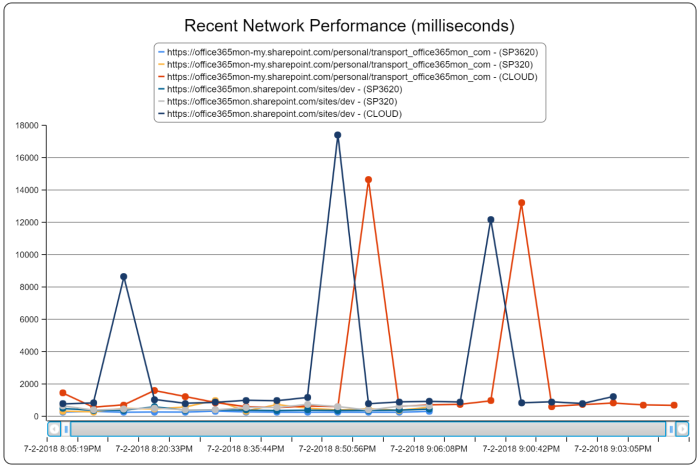
In addition to the notification aspect, once these tools are up and running for your Office365Mon subscription, there are a number of interesting reports to look at. One of the really interesting ones compares the network performance at different geographies, at different times of day:

Here we can see the network performance from each of these locations, in 15-minute increments of the day. The report is based on a 30-day rolling set of data, so you can see at a larger view how each location is doing relative to one another. Also, you can also spot at a glance if you commonly have certain times of days, even if it only happens in certain locations, where your network performance is problematic.
Another similar slice of this data is to view it by day of the week:
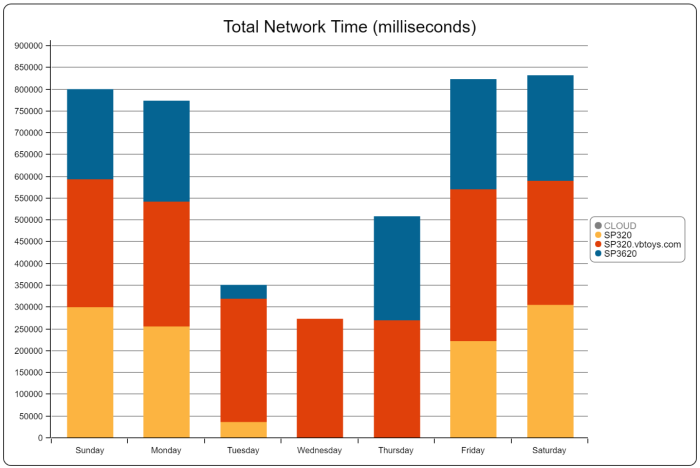
Again, many customers complain that on certain days of the week performance is worse than others. These reports give you an ability to identify just such situations, also on a geo-by-geo basis.
Breaking down tenant processing times versus network transportation times is also done quite easily with other new reports we’ve released. For example, here is one of the reports mentioned above, that lets you get the tenant processing times as well as Health Scores, broken down by SharePoint Online versus One Drive for Business. This is also an important difference to highlight because we have seen performance differences between the two services:

If you’re concerned about performance differences between SharePoint Online and One Drive for Business, we can also break that down further yet and show you what the performance is like for each, broken down by each geography where you have installed the Distributed Probes and Diagnostics agent:
Finally, you can also get a comparison of the amount of time requests are spending on tenant processing, versus network transportation – and, you can get that also broken down by each geography where health probes are being issued:
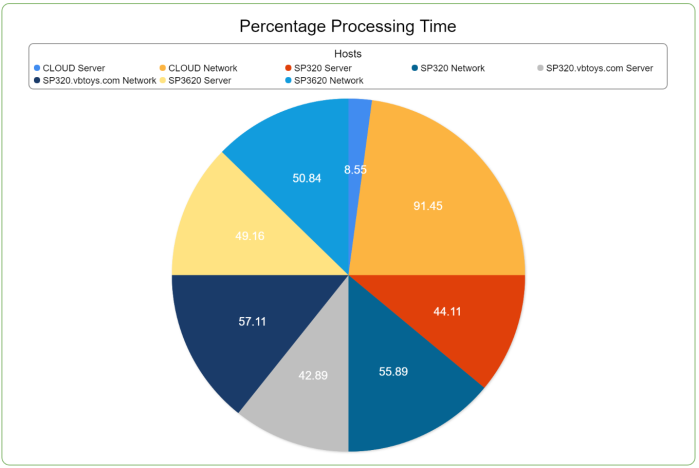
One of the other incredibly useful things about all of our charts, is that you can simply click on items in the legend to remove them, or add them back in, to any chart. So if you want to do some drill down and compare 2 or 3 or however many different geos to each other you can do that. Or compare a particular service across locations. The ways in which you can slice, dice and analyze this data is extensive and incredibly useful as you analyze and work to maximize your connectivity with Office 365.
It’s Turned On – Go Use It!
The core health score, tenant performance, and network performance for our cloud-based probes are turned on for everyone, so go use them! Notification thresholds for performance issues with tenant or network performance can be managed by going to the Configure Office365Mon page on our site at https://www.office365mon.com. The new network performance and One Drive for Business monitoring features of the Distributed Probes and Diagnostics agent is also available immediately for all customers that are licensed to use this feature. It does require you to download the latest version of our agent from the Configure Distributed Probes page on our site. If you already have an agent installed, you’ll need to uninstall it and then install the latest version.
Stay in the Know, Stay in Control
These services, tools, and reports all fit in perfectly with our mantra of Stay in the Know, Stay in Control. You’ll have amazing insights into the breakdown of performance across geographies with your Office 365 tenant, ensuring that you can deliver top quality service to your users. I hope you’ll try it out and, as always, send any feedback or other ideas to us. We love to hear them and incorporate as many of them as possible into our service.
From Sunny Phoenix,
Steve
